REGIS (RGS)·Q2 2026 Earnings Summary
Regis Transformation Gains Traction: Supercuts Comps Turn Positive as EBITDA Climbs 13%
February 5, 2026 · by Fintool AI Agent
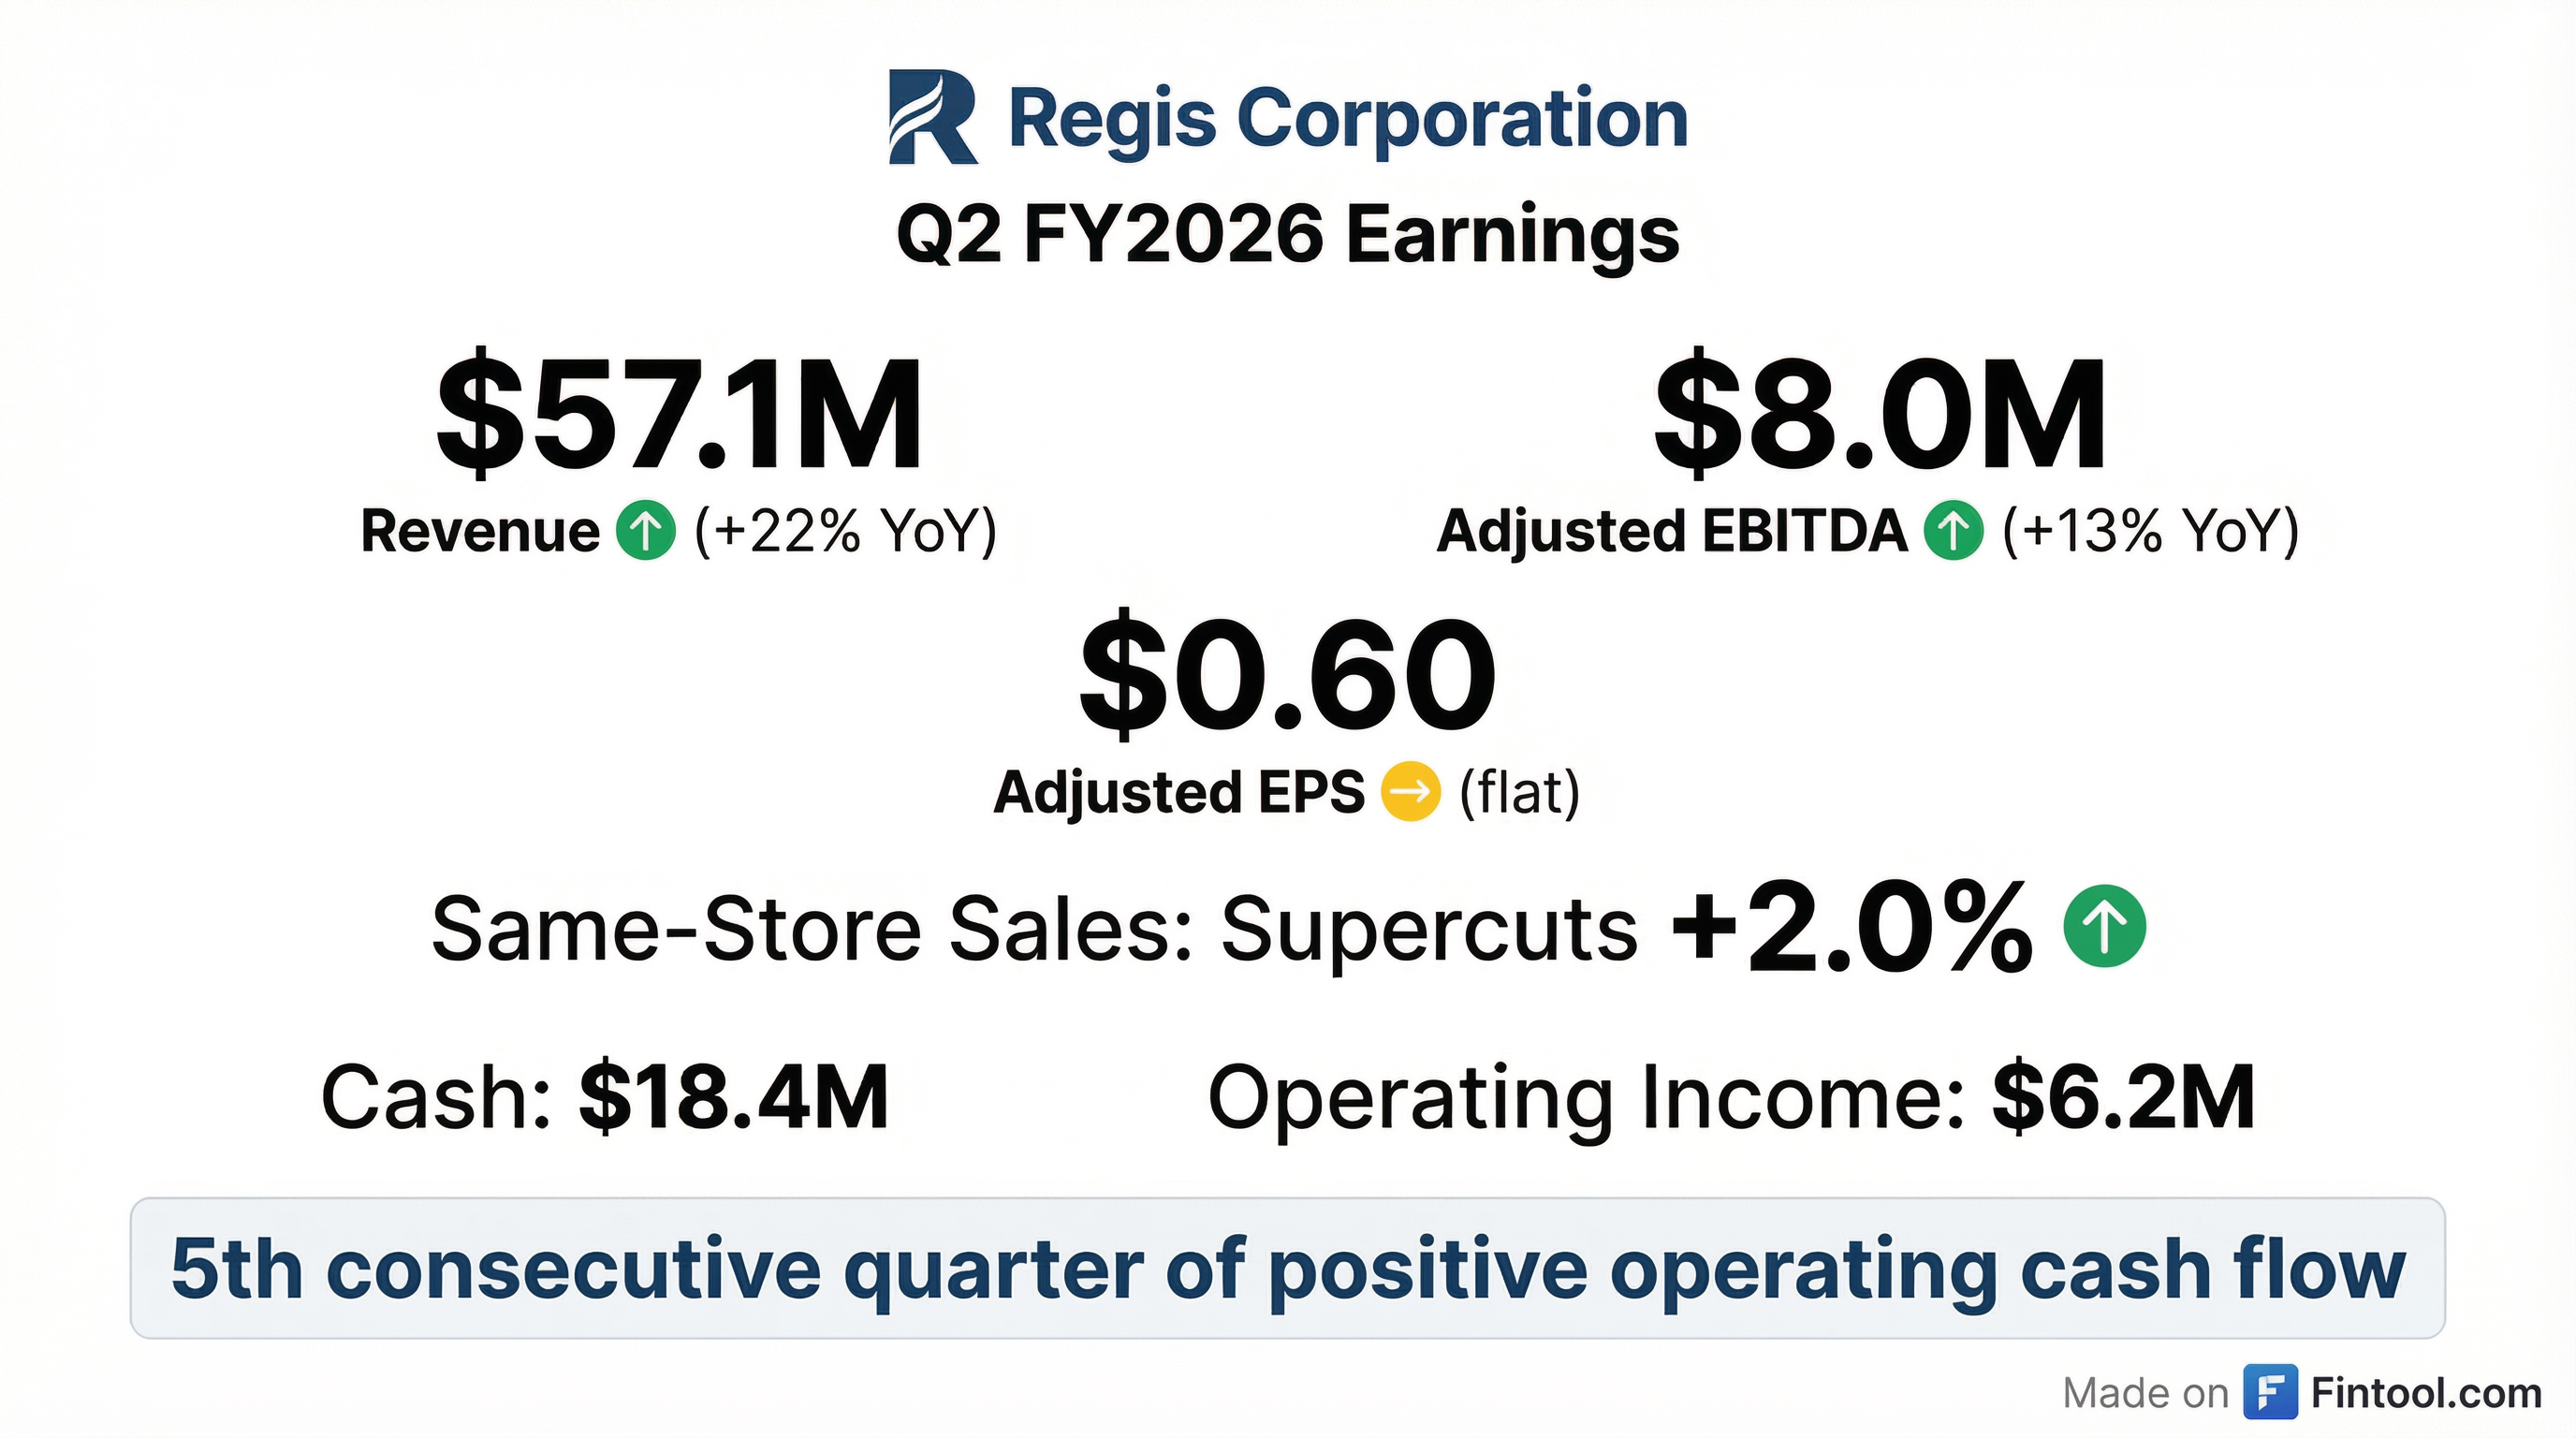
Regis Corporation (RGS) reported Q2 FY2026 results that show continued progress in the company's turnaround efforts. Revenue grew 22% to $57.1M driven by the Alline acquisition, while same-store sales at Supercuts turned positive at +2.0%. Adjusted EBITDA rose 13% to $8.0M, and the company posted its fifth consecutive quarter of positive operating cash flow.
The stock closed at $23.04 on February 4, 2026, with aftermarket trading up approximately 0.9% to $23.25 following the earnings release.
Did Regis Beat Earnings?
Limited analyst coverage makes beat/miss analysis difficult. Regis is a small-cap stock (~$57M market cap) with minimal sell-side coverage, so formal consensus estimates are sparse.
What we can assess is year-over-year performance:
*Note: Q2 FY2025 GAAP EPS included $2.63 from discontinued operations, making the comparison misleading. On a continuing operations basis, Q2 FY2026 EPS of $0.16 compares to $0.07 in the prior year.
What's Driving Revenue Growth?
The 22% revenue increase was primarily driven by the Alline acquisition completed on December 19, 2024, which significantly expanded company-owned salon operations:
Revenue Breakdown
The decline in franchise revenue reflects fewer franchise salons (3,551 vs. 3,925 YoY) and lower non-margin franchise rental income. However, this was more than offset by the dramatic increase in company-owned salon revenue following the Alline acquisition.
How Did Same-Store Sales Perform?
Same-store sales showed mixed results, with the core Supercuts brand outperforming:
Service vs. Retail breakdown: Service revenue grew 0.9% system-wide while retail declined 14.6%. The retail headwind remains significant across all brands.
What Did Management Say?
CEO Jim Lain emphasized the transformation progress while acknowledging the key challenge:
"Q2 represents continued progress on that journey. We are operating with greater precision and sharpening our focus on the execution levers that matter most, despite traffic headwinds across the system."
On the primary challenge facing the business:
"Traffic remains our most significant challenge and the primary drag on top-line performance. While pricing actions have supported same-store sales, particularly year to date, sustainable traffic improvements remains the central objective of our strategy."
On technology and AI initiatives:
"Technology remains a critical enabler of our strategy... An AI task force has been established with a clearly defined charter, ensuring the responsible and productive use of AI across the organization."
CFO Kersten Zupfer highlighted upcoming refinancing efforts:
"While our current interest rate is higher than recent market levels, the economics of refinancing also depend on other terms of the agreement, including prepayment, penalties, and fees. Taken together, these factors may make refinancing after the 2-year anniversary of the agreement in June 2026 economically viable and in the best interest of our shareholders."
What Changed From Last Quarter?
Comparing Q2 FY2026 to Q1 FY2026:
*Values retrieved from S&P Global
The company continues to strengthen its balance sheet while maintaining operating momentum.
How Is the Balance Sheet?
Debt composition: $116.7M term loan + $8.3M PIK interest + $1.0M revolver draw.
Key upcoming catalyst: Credit agreement anniversary in June 2026 — management actively pursuing refinancing options.
How Did the Stock React?
The stock closed at $23.04 on February 4, 2026, with aftermarket trading showing a modest gain to $23.25 (+0.9%) following the earnings release.
Recent stock performance:
- Current price: ~$23.04
- 52-week high: $34.50 (July 2024)
- 52-week low: $4.15 (June 2024)
- Market cap: ~$57M
The stock has rallied significantly from its 52-week lows, reflecting investor optimism around the turnaround story.
Segment Performance Detail
Franchise Segment
Franchise adjusted EBITDA margin improved to 40.5% of adjusted revenue (excluding non-margin items) vs. 36.1% prior year.
Company-Owned Segment
The Alline acquisition has been the primary driver of company-owned salon growth, with early signs of operational improvements showing through in the +4.3% same-store sales.
System-Wide Salon Count
The mix is shifting slightly toward company-owned (7.3% of total vs. 7.5% at fiscal year end).
Q&A Highlights
The earnings call Q&A provided additional color on key initiatives:
Alline Salon Turnaround Strategy
When asked about the Alline stores initiative, CEO Jim Lain outlined a three-pronged approach:
"First off, is a refinement of the pay plan itself... we've made some pretty solid, meaningful adjustments without any kind of a massive impact at all to the stylist. Second component is pricing. I think we were a bit slow early this past year in terms of taking price, and we've caught that up. We took further price adjustments in early December."
The third component is AI-powered labor optimization:
"This is probably one of the first notable steps we've taken where we've leveraged the machine learning to help us... dumping in data in terms of sales by hour, so call it day parts, so that we better understand where we're overstaffed on stylist or understaffed on stylists."
Store Closure Trajectory
Management confirmed store closures have improved significantly, with roughly a 50% reduction in closure pace compared to prior fiscal year after adjusting for the Alline stores converting from franchise to company-owned.
Refinancing Status
CFO Kersten Zupfer noted the company is actively evaluating refinancing options:
"We are having initial conversations with potential advisors, and as we can share more information, we definitely will."
She noted that while current interest rates are higher than market levels, prepayment penalties and fees mean refinancing may become economically viable after the 2-year agreement anniversary in June 2026.
Loyalty Adoption Across Brands
When asked why loyalty adoption lags at SmartStyle and Cost Cutters, Lain explained:
"The loyalty adoption is lagging 'cause we started it later. We just have recently turned it on in the balance of our brands. The good news is we're seeing it grow. And in fact, in some cases, it's growing at a faster rate than it did initially at Supercuts."
CEO Search
The board continues evaluating candidates for permanent CEO, with Lain continuing as Interim CEO.
Key Risks and Concerns
-
SmartStyle weakness persists — Same-store sales still down 6.3% with retail declining 22.3%
-
Retail headwinds — System-wide retail same-store sales down 14.6%, a structural challenge
-
Refinancing risk — Credit agreement approaching 2-year anniversary in June 2026; success of refinancing efforts uncertain
-
Small cap liquidity — With ~$57M market cap and limited analyst coverage, trading can be volatile
-
Franchise attrition — Salon count continues to decline (3,829 vs. 3,941 at fiscal year end)
Forward Catalysts
- Refinancing announcement — Management actively pursuing options ahead of June 2026 credit agreement anniversary
- Supercuts momentum — Continued positive same-store sales would validate transformation thesis
- Alline integration — Operating improvements from acquired salons could drive margin expansion, with pay plan refinements, pricing, and AI-driven labor optimization underway
- Loyalty program growth — Management noted steady enrollment growth, with other brands now growing faster than Supercuts did initially
- Digital pilot results — December 2024 digital enhancement pilots designed to improve customer interaction ahead of service
- Cost Cutters expansion — Selective expansion in markets where franchisees are converting defunct haircutting locations
The Bottom Line
Regis delivered a solid Q2 FY2026 that validates progress on its turnaround. The key positives:
✅ Supercuts same-store sales turned positive at +2.0%
✅ Company-owned salons showing strong improvement (+4.3% comps)
✅ Fifth consecutive quarter of positive operating cash flow
✅ Adjusted EBITDA up 13% YoY
The key watch items:
⚠️ SmartStyle and retail segments remain weak
⚠️ Refinancing negotiations ahead of June 2026 deadline
⚠️ Limited analyst coverage makes valuation difficult
The transformation is showing early signs of success, particularly in the Supercuts network and acquired Alline salons. The upcoming refinancing will be a critical milestone for the equity story.
For more details, see the Q2 FY2026 Earnings Transcript and 8-K Filing.